
Data
Figures reported in the October 2019 whitepaper.
Historical data
Figures have not been updated. Incident definitions and reporting periods vary by source.
Education enrollment
2019 projections · NCES · Report page 4
Public K–1250.8m
Private K–125.8m
Higher education19.9m
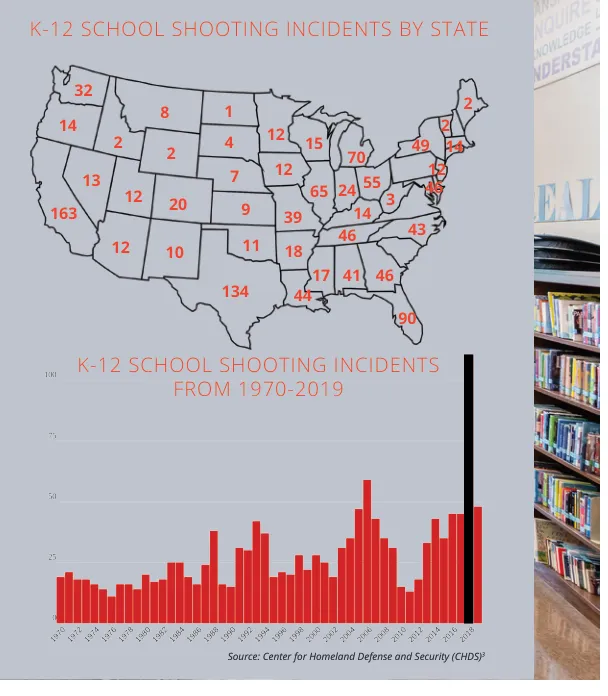
School shooting incidents, 1970–2019
State totals and annual K–12 incidents, as published in the report. Source: Center for Homeland Defense and Security.
Source discrepancy
Page 6 states that 21st-century shootings exceeded the 20th-century total. Page 21 reports 172 in the 1900s and 148 since 2000. These claims conflict and should not be used as a verified comparison.
Reported figures
Scroll to view all columns.
No figures match. Try a shorter term or clear the search.
| Metric | Reported value | Period / context | Printed page | Notes |
|---|---|---|---|---|
| U.S. population | 329.62 million | 2018 census, as cited | 4 | Whitepaper demographic baseline |
| Elementary, middle and high school students | 56.6 million | 2019–20 projection | 4 | National K–12 enrollment |
| Public school students | 50.8 million | 2019–20 projection | 4 | Subset of K–12 enrollment |
| Private or parochial school students | 5.8 million | 2019–20 projection | 4 | Subset of K–12 enrollment |
| College and university students | 19.9 million | Fall 2019 projection | 4 | Higher education enrollment |
| Teachers, administrators, counselors and related staff | 3.7 million | Fall 2019 projection | 4 | Whitepaper workforce figure |
| Education demographic | More than 80 million | 2019 report | 4 | Combined population reported by authors |
| Share of U.S. population | 25% | 2019 report | 4 | Rounded estimate reported by authors |
| People killed in school shootings since Columbine | 301 | As reported in 2019 | 4 | Attributed to Newsweek; historical total |
| People injured in school shootings since Columbine | 461 | As reported in 2019 | 4 | Attributed to Newsweek; historical total |
| School gun-violence incidents | 110 | 2018 | 6 | Whitepaper figure; incident definitions may differ |
| Male perpetrators of school violence | More than 95% | 2019 report | 8–9 | Source-reported characterization, not a screening rule |
| Youth violence age range | 10–24 years | 2019 report | 9 | Age range in source infographic |
| School shootings in the 1900s | 172 | 20th century, as reported | 21 | Source-reported comparison; see data note |
| School shootings since 2000 | 148 | 2000–2019, as reported | 21 | Source-reported comparison; see data note |
| Difference in century totals | 24 | 2019 report | 21 | 172 minus 148; source comparison |
| Founding council participation | More than 130 | 2018–2019 | 10–12 | Police chiefs, agencies and first responders |
| Principals and administrators in tabletop forums | More than 45 | Summer 2019 | 19 | Houston, Dallas and Austin sessions |
| Numbered best practices | 32 | 2019 report | 12–19 | All recommendations reproduced in this website |
| Chief Alan Bragg’s law enforcement experience | 45 years | At time of publication | 11, 22 | Historical leadership biography |
| Ian Powell’s school-safety forums | More than 30 | Since May 2018, as reported | 22 | Historical leadership biography |
| Crime Stoppers school outreach began | 1997 | As reported in 2019 | 18 | Historical testimonial |
| Panic-button locations in example campus | 7 | 2019 case study | 20 | Campus-specific example, not a universal requirement |
| Great Chicago Fire deaths | Approximately 300 | 1871 | 8 | Historical fire-code discussion |
| Iroquois Theater Fire deaths | 602 | 1903 | 8 | Historical fire-code discussion |
| Triangle Shirtwaist Fire deaths | 147 | 1911, as reported | 8 | Whitepaper value retained; not independently reconciled |
| Ohio State Penitentiary Fire deaths | 320 | 1930 | 8 | Historical fire-code discussion |
| Cocoanut Grove Nightclub Fire deaths | 492 | 1942 | 8 | Historical fire-code discussion |
| Cocoanut Grove Nightclub Fire injuries | 200 | 1942 | 8 | Historical fire-code discussion |
| September 11 lives lost | 2,996 | 2001, as reported | 7 | Historical comparison in source |
| Suggested officer staffing | 1 officer per 1,000 students or more | 2019 recommendation | 12 | Campus context and partnerships discussed in practice 1 |
| Emergency call stations: elementary | 1 at playground | 2019 recommendation | 12 | Practice 2 |
| Emergency call stations: middle school | 2–3 | 2019 recommendation | 12 | Practice 2 |
| Emergency call stations: high school | At least 5 | 2019 recommendation | 12 | Practice 2 |
| Perimeter fence height | 8 feet | 2019 recommendation | 12 | Practice 3; adapted to community conditions |
| Video retention | At least 6 months | 2019 recommendation | 14 | Practice 8; on- and off-site storage |
| Secure vestibules: elementary | 1–2 | 2019 recommendation | 16 | Practice 12 |
| Secure vestibules: middle / junior high | 2–3 | 2019 recommendation | 16 | Practice 12 |
| Secure vestibules: high school | 4–6 | 2019 recommendation | 16 | Practice 12 |
| Password minimum in source | 8 characters | 2019 recommendation | 18 | Historical practice 31; consult current cyber guidance |
| Facilities-rule review deadline in quoted SB 11 | September 1 of each even-numbered year | 2019 legislative excerpt | 9 | Historical excerpt; consult current Texas requirements |
Source: Together for Tomorrow. Council dates appear in the timeline.